实时结果
从 JMeter 2.13 开始,你可以通过提供一个实现 AbstractBackendListenerClient 的类,使用可能使用任何后端(JDBC、JMS、Webservice……)的 Backend Listener 将实时结果发送到后端 。 JMeter 附带:
- 一个 GraphiteBackendListenerClient,它允许你将指标发送到 Graphite 后端。
此功能提供:- 实时结果
- 漂亮的指标图表
- 能够比较 2 个或更多负载测试
- 存储监控数据只要 JMeter 产生相同的后端
- …
- JMeter 3.2 中引入的 InfluxDBBackendListenerClient 允许你使用 UDP 或 HTTP 协议将指标发送到 InfluxDB 后端此功能提供:
- 实时结果
- 漂亮的指标图表
- 能够比较 2 个或更多负载测试
- 能够向图形添加注释
- 存储监控数据只要 JMeter 产生相同的后端
- …
在本文档中,我们将介绍配置设置以绘制和历史记录不同后端中的数据:
- InfluxDBBackendListenerClient 的 InfluxDB 设置
- GraphiteBackendListenerClient 的 InfluxDB 设置
- Grafana
- Graphite
15.1 公开的指标
15.1.1 线程/虚拟用户指标
线程指标如下:
<rootMetricsPrefix>test.minAT

最小活动线程

<rootMetricsPrefix>test.maxAT

最大活跃线程数

<rootMetricsPrefix>test.meanAT

平均活跃线程

<rootMetricsPrefix>test.startedT

已启动线程

<rootMetricsPrefix>test.endedT

成品螺纹
15.1.2 响应时间指标
响应相关指标如下:
<rootMetricsPrefix><samplerName>.ok.count

采样器名称的成功响应数

<rootMetricsPrefix><samplerName>.h.count

服务器每秒点击次数,此指标累积 Sample Result 和 Sub 结果(如果使用 Transaction Controller,则应取消选中“Generate parent sampler”)

<rootMetricsPrefix><samplerName>.ok.min

采样器名称成功响应的最短响应时间

<rootMetricsPrefix><samplerName>.ok.max

采样器名称成功响应的最大响应时间

<rootMetricsPrefix><samplerName>.ok.avg

采样器名称成功响应的平均响应时间。

<rootMetricsPrefix><samplerName>.ok.pct<percentileValue>

为采样器名称的成功响应计算的百分位数。每个计算值都有一个指标。

<rootMetricsPrefix><samplerName>.ko.count

采样器名称的失败响应数

<rootMetricsPrefix><samplerName>.ko.min

采样器名称响应失败的最短响应时间

<rootMetricsPrefix><samplerName>.ko.max

采样器名称失败响应的最大响应时间

<rootMetricsPrefix><samplerName>.ko.avg

采样器名称失败响应的平均响应时间。

<rootMetricsPrefix><samplerName>.ko.pct<percentileValue>

为采样器名称的失败响应计算的百分位数。每个计算值都有一个指标。

<rootMetricsPrefix><samplerName>.a.count

采样器名称的响应数(ok.count 和 ko.count 的总和)

<rootMetricsPrefix><samplerName>.sb.bytes

发送字节

<rootMetricsPrefix><samplerName>.rb.bytes

接收字节

<rootMetricsPrefix><samplerName>.a.min

采样器名称响应的最短响应时间(ok.count 和 ko.count 的最小值)

<rootMetricsPrefix><samplerName>.a.max

采样器名称响应的最大响应时间(ok.count 和 ko.count 的最大值)

<rootMetricsPrefix><samplerName>.a.avg

采样器名称响应的平均响应时间(ok.count 和 ko.count 的平均值)

<rootMetricsPrefix><samplerName>.a.pct<percentileValue>
为采样器名称的响应计算的百分位数。每个计算值都有一个指标。(根据合格和不合格样品的总数计算)
Backend Listener 上 的默认百分位数设置为“90;95;99”,即 3 个百分位数 90%、95% 和 99%。
Graphite 命名层次结构 使用 点(“.”)来分隔元素。这可能与十进制百分位值混淆。JMeter 转换任何此类值,用下划线 ("-") 替换点 (".")。例如,“ 99.9 ”变成“ 99_9 ”
默认情况下,JMeter 发送在 samplerName“ all ”下累积的所有采样器的指标。如果配置了后端侦听器 samplersList,则 JMeter 还会发送匹配样本名称的指标,除非 summaryOnly=true
15.2 JMeter 配置
要让 JMeter 将指标发送到后端,请使用 InfluxDBBackendListenerClient 添加一个 BackendListener 。
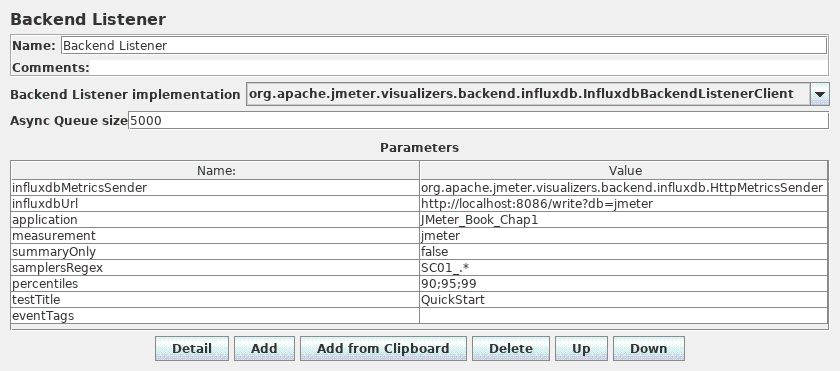
流入数据库配置
15.3 InfluxDB 配置
执行以下操作之一来存储后端侦听器发送的数据:
- 对于 InfluxDB 2 设置,创建一个 jmeter bucket
- 对于 InfluxDB 1.x 设置,使用 Influx CLI 创建一个 jmeter 数据库
你还可以使用 HTTP API,即 curl -i -XPOST http://localhost:8086/query --data-urlencode "q=CREATE DATABASE jmeter"
15.3.1 InfluxDBBackendListenerClient 的 InfluxDB 设置
InfluxDB 是一个开源、分布式、时序数据库,可以轻松存储指标。安装和配置非常简单,阅读本文了解更多 InfluxDB 文档 的详细信息。
InfluxDB 数据可以通过 Grafana 在浏览器中轻松查看。
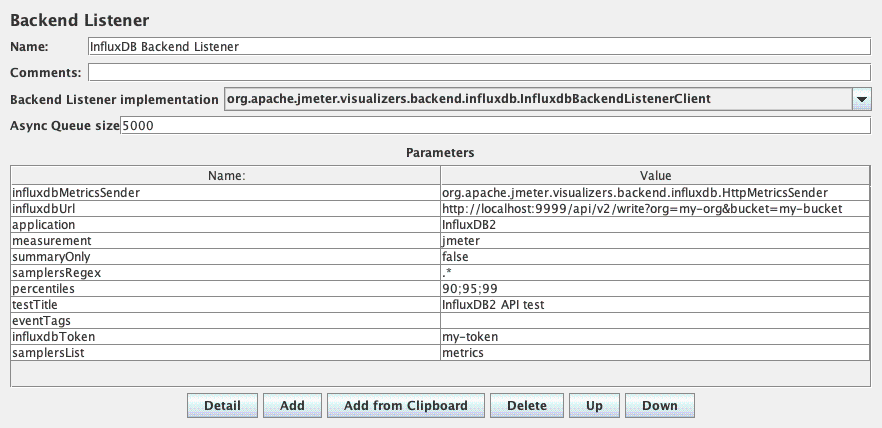
15.3.2 InfluxDBBackendListenerClient 的 InfluxDB 2 设置
配置应指定 influxdbToken 参数,并在 influxdbUrl 中指定 bucket 和 org 作为查询参数。有关更多详细信息,请参阅 InfluxDB v2 API 。
如何在 InfluxDB UI 中检索所需信息:
15.4 Grafana 配置
安装 grafana
阅读 文档 以获取更多详细信息。添加 数据源
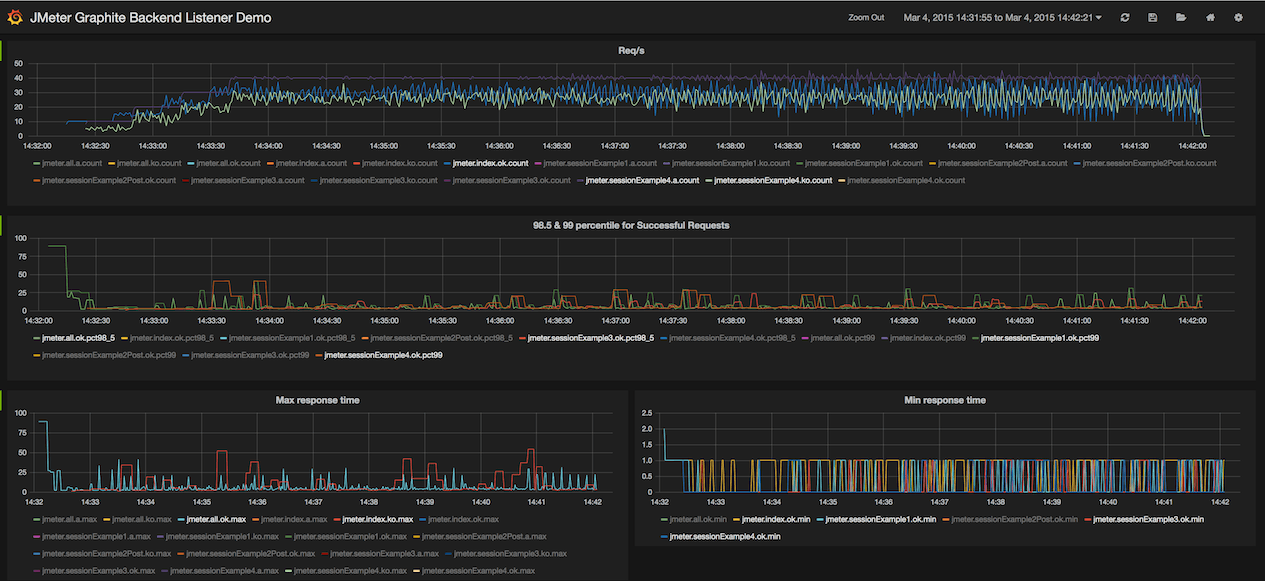
这是你可以获得的仪表板类型:
15.5 Graphite Configuration
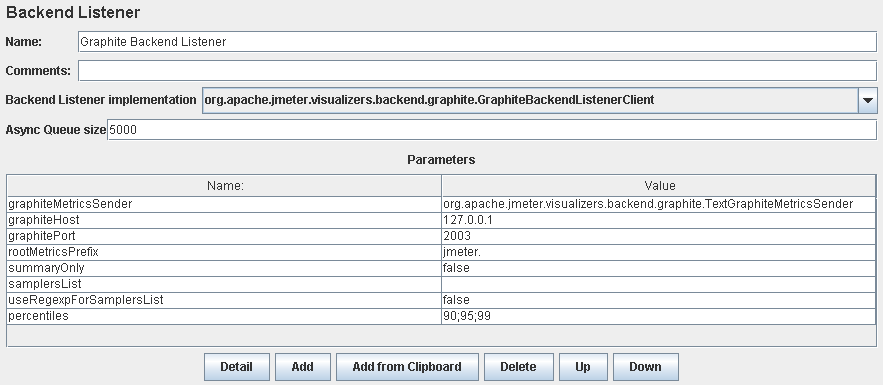
To make JMeter send metrics to backend, add a BackendListener using the GraphiteBackendListenerClient.
GraphiteBackendListenerClient section will help you do the configuration.
15.5.1 Graphite Sender
Two types of Senders are available. TextGraphiteMetricsSender, PickleGraphiteMetricsSender
- For plaintext protocol, set graphiteMetricsSender parameter to org.apache.jmeter.visualizers.backend.graphite.TextGraphiteMetricsSender
- For pickle protocol, set graphiteMetricsSender parameter to org.apache.jmeter.visualizers.backend.graphite.PickleGraphiteMetricsSender
To send large amounts of data, use the Pickle sender. It is a more efficient transmission method compared to textplain. Read the Graphite documentation for more details.
